Africa Graph Indicates Financial Report And Analysis
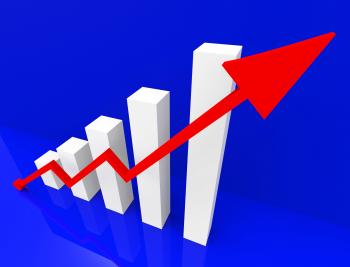
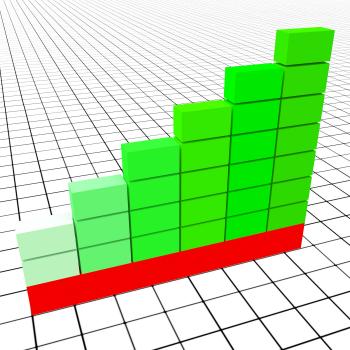
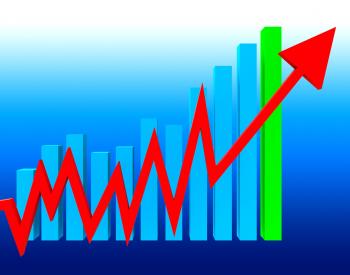
Graph Increasing Indicates Growth Statistics And Increase
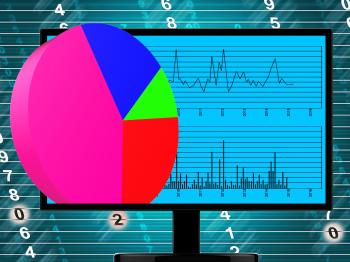
Online Report Represents World Wide Web And Computing
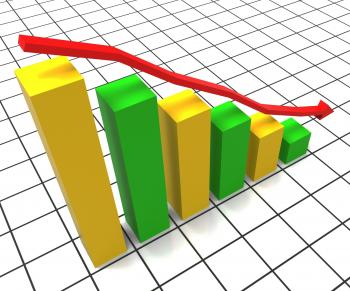
Decreasing Report Shows Graphic Analysis And Graphs
Graph Report Represents Trade Corporate And Finance
Target Report Represents Business Graph And Analysis
Increase Revenue Represents Business Graph And Advancing
Improve Graph Indicates Improvement Plan And Data
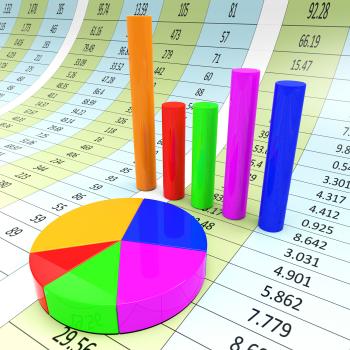
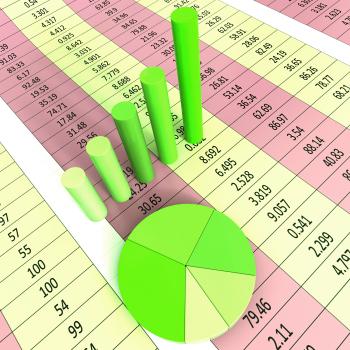
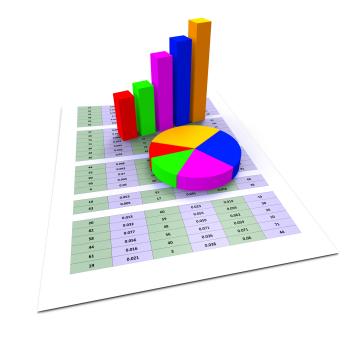
Pie Chart Report Means Data Reports And Graph
Cute Little Girl Showing Thumbs Up - Creativity and Great Ideas
Cute Little Girl Raising Finger
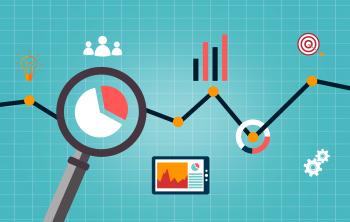
ata Analytics Concept
Online content marketing and web analytics concept
Web analytics concept with data icons
Web analytics concept - Multicolor version
Call to action using social networks
Big Data Analytics
Arrow Pointing Up On Screen Showing Positive Results
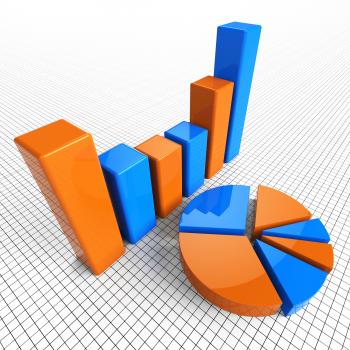
Pie Chart And 3d Characters Represents Statistics Report
Cancer Graph Indicates Cancerous Growth And Diagram
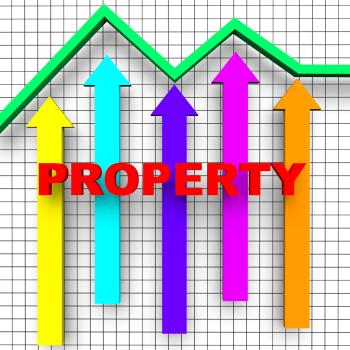
Property Report Indicates Business Graph And House
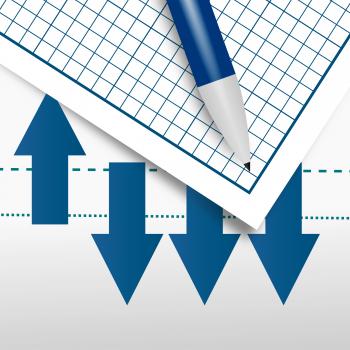
Pen on paper with blue arrows - Office work concept
Pen on paper with red arrows - Office work concept
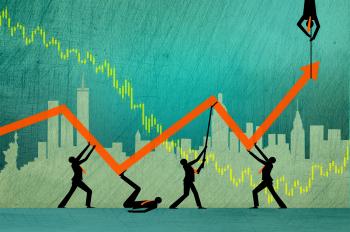
The search for profit when markets are volatile
Concept of Search Engine Optimization with SEO icons
Concept of Search Engine Optimization
Data Graphs Means Statistical Diagram And Bytes
Graph Report Indicates Diagram Charts And Analysis
Beating the Street - Or how to make money in stocks
Revenues Charts Represents Business Graph And Salary
Statistics Data Indicates Stats Bytes And Reports
Info Dice Show Facts Data And Details
Graph Report Shows Infograph Finance And Graphic
Analyzing a Pie Chart
Businessmen parachuting on Manhattan
Percent Sign With 3d Man Shows Percentage Or Discount
Arrow Pointing Up On Smartphone Showing Progression Report
Big Discount Indicates Cut Rate And Data
Prices Increase Represents Financial Report And Diagram
Stats Puzzle Shows Statistics Reports Or Analysis
Pie Chart Report Represents Business Graph And Diagram
Reports Dice Represent Reported Information or Articles
Pie Chart Report Indicates Business Graph And Document
Data Charts Indicates Business Graph And Bytes
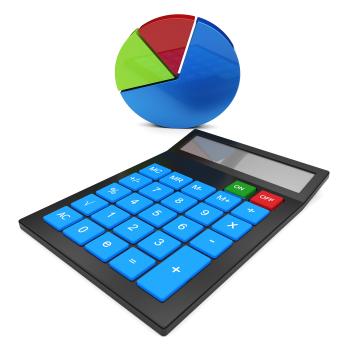
Pie Chart Indicates Financial Report And Charts
Graph Report Shows Graphs Charts And Infochart
Infographic Computer Indicates Infographics Online And Statistics
Pie Chart Indicates Stat Graphics And Infochart
Profits Graph Shows Earn Investment And Diagram
Investment Charts Shows Business Graph And Forecast
Business Graph Indicates Diagram Infochart And Profit
Risk Graph Shows Infochart Beware And Risky
Data Dice Displays Info Statistics And Backup
Graph Increasing Shows Financial Report And Advance
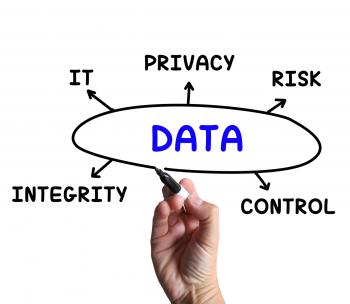
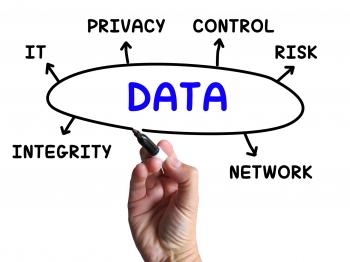
Data Diagram Means IT Control And Risk
Budget Graph Means Costing Expenditure And Statistic
Data Post-It Note Shows Information Privacy And Control
Graph Earn Represents Graphics Salaries And Income
Cash Flow Graph Represents Investment Earn And Wage
Investment Guide Indicates Business Graph And Advise
Financial Charts Shows Business Graph And Banking
Progress Arrows Represents Business Graph And Advance
Improve Economy Shows Business Graph And Advance
Investment Rates Represents Invested Percent And Percentage
Business Graph Means Infochart Diagram And Statistic
Arrow Pointing Up On Screen Shows Successful Sales
Line Over Bar Chart Shows Profit Follows Budget
Network - Cloud Computing
Network - Cloud Computing - Inverted
Success Graph Means Winner Resolution And Winning
Consumer Price Index Represents Web Site And Website
Pie Chart Shows Business Graph And Charting
Data Dice Mean Information Statistics And Input
Arrow Going Up On Screen Shows Sudden Growth
Growing Chart Showing Economy Reports
Savings Increasing Indicates Financial Report And Advance
Report Graph Represents Infograph Diagram And Financial
Finance Professional - Broker - Financial Advisor
Finance Professional - Broker - Financial Advisor - Analyst
Graph Report Indicates Business Statistic And Diagram
Decreasing Report Represents Business Graph And Decrease
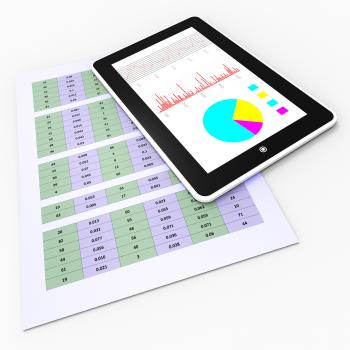
Online Reports Means Tablet Pc And Charting
Data Diagram Means Information Privacy And Integrity
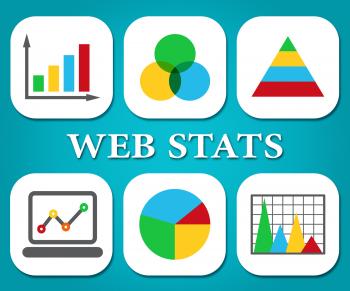
Web Stats Indicates Business Graph And Analysing
Painted Lightbulb - Creativity and Imagination Concept - Abstract
Report Dice Represent Reported Information or Articles
Calculate Statistics Shows Calculated Data And Statistical
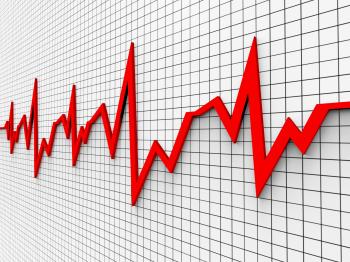
Heartbeat Chart Shows Flat Screen And Cardiograph
Reports Charts Shows Business Graph And Data
Reports Sphere Definition Means Statistical Diagram Or Company Financi
Online Stats Means Web Site And Analysing
Report Blocks Represent Reported Information or Articles
Arrow Rising On Smartphone Shows Progress Chart
Statistics and Trends - Upward Trend - Abstract Image
Sending E-Mail - Electronic Mail Communication
Increase Graph Represents Text Space And Copy
Pie Chart Online Represents Financial Report And Web
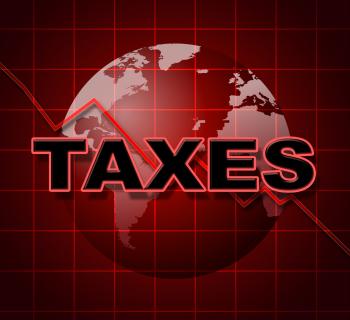
Taxes Graph Means Duty Statistical And Infograph
Analytics Charts Represents Business Graph And Statistics
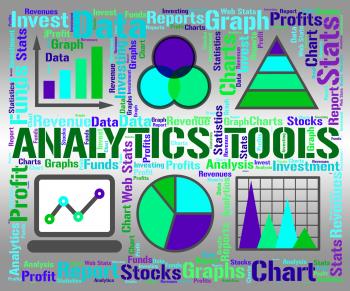
Analytics Tools Represents Business Graph And App
Graph Audit Indicates Auditing Infograph And Scrutiny
Percent Sign With 3d Man Climbing Showing Percentage
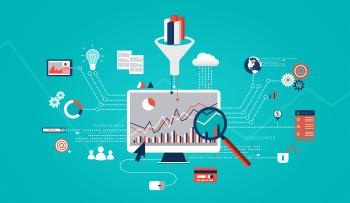
Web Analytics - From Raw Data to Target
Statistics and Figures - Data Analytics Concept
Project Management - Budget Planning - Illustration
Market Research and Marketing Strategy Concept
Marketing Strategy Concept - With Copyspace
Graph Increasing Means Statistics Infochart And Investment
Big Data Analysis Abstract Concept - Light Version
Big Data Analysis - Abstract Concept
Exports Increasing Shows International Selling And Exportation
Juggling Percent Sign With 3d Man Climbing Showing Percentage
Analyst Working on Laptop
Hand placing coins on a coin stack with upward arrow
Money and financial assets growth concept
Businessman With Pen Over Financial Data
Businessman drawing a financial graph
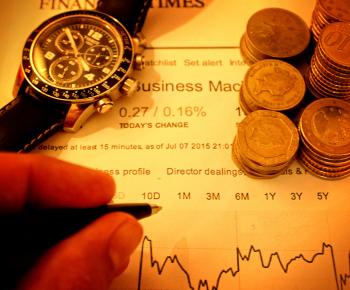
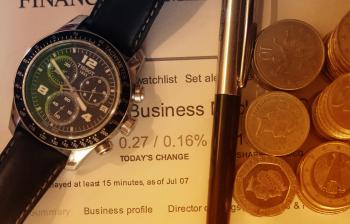
Money with pen and watch
Money and Financial Data
World map made of US cent coins
Hands showing euro coins
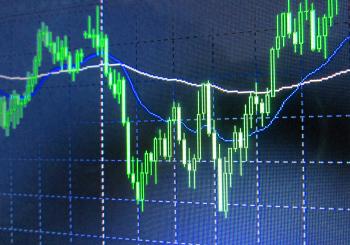
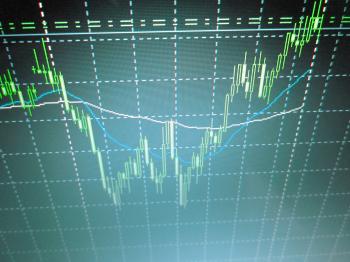
Stock Market Chart
Stock market graph
3D Chart
Person Picking a Coin - Money and Finance Concept
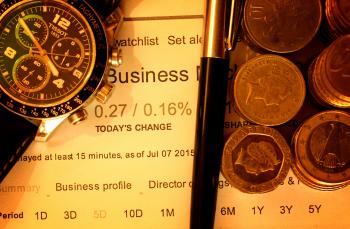
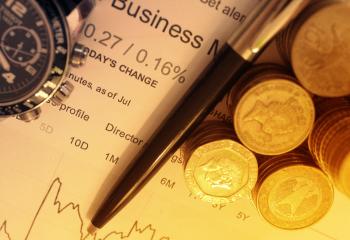
Money - Euros and British Pounds - Financial Markets Concept with Watc
Euros and British Pounds - Finance Concept with Watch - Brexit
Euros and British Pounds - Finance Concept - Brexit
Business and Finance Concept - Business Word on Financial Newspaper
Business and Finance - Money and Financial Newspaper
Formula on blackboard
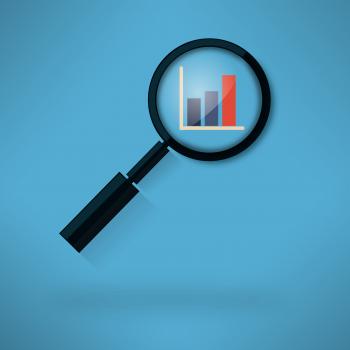
Analyzing histogram with magnifying glass
Graph and hand
Blank Paper And Calculator Shows Calculating Copyspace Statistics
Business meeting and teamwork - Large team at the table
Business meeting and teamwork concept
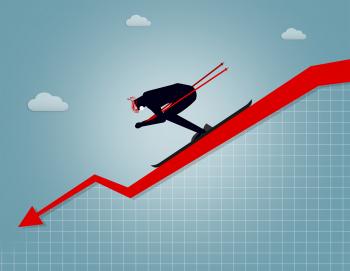
Businessman going downhill - Market crash and correction concept
Businessman riding an arrow - Success and finance concept
The Big Data Deluge
Social media and marketing campaign concept
Businessman drawing an arrow over stack of coins
Businessman looking for financial success